Business intelligence in the blink of an eye – Data dashboards with Microsoft Power BI
November 26, 2019 / 5 min read

User sessions, page views, click-through rate, likes, retweets, etc. The amount of data that show how your target audience engages with your website, is huge. Many companies understand that there is a goldmine of business intelligence hidden within this enormous pile of data. But in order to find gems of insights, a lot of digging is required. Usually at least.
A user-friendly and integrated dashboard is a helpful companion in this quest for insights. Recently, we created a dashboard for one of our clients to help them fully leverage the data they collect from their online platforms.
In this article, we will show you how such a dashboard can be a valuable asset both for day-to-day work and for strategic, long-term planning.
Big companies have big piles of data
One of our clients is a global provider of medical devices and equipment. They produce highly specialised innovative solutions for medical institutions all over the world and employ more than 10,000 employees in 40 countries all over the world.
As you would expect from a company that size, they have a broad online presence. Their website exists in 17 language versions and they are active on different social media platforms such as YouTube, Twitter and LinkedIn. They also use HubSpot for reporting on marketing and sales activities.
Our client was looking for a way to gather all the data coming from their platforms and organise them in a dashboard, customised depending on the role of the employee. By integrating and aggregating the right data sources, every employee should get a dashboard with information relevant to his/her day-to-day work.
 Photo by Markus Spiske on Unsplash
A good dashboard – effectiveness and user-focused design
At first glance, creating a dashboard might seem simple and straight-forward. Nowadays nearly all tools and platforms have an API. So to some extent you just have to combine these APIs with Microsoft Power BI, DAX, or some other sophisticated tool, put them in your favourite software and voila… You have your own dashboard.
To some extent this is the case. But to get the best out of your dashboard, there are a few extra elements you can take into consideration.
First of all, it’s a good idea to assess dashboard tools according to their efficiency, customisation options and the need for higher performance capacity. It should be possible to expand the dashboard and add more precision with for example Big Query, while retaining the same high efficiency.
With a good data warehouse as a foundation, you can start thinking about how to make insights more visual. Make sure to keep in mind this famous quote:
“[Design] is not just what it looks like and feels like. Design is how it works.”
Steve Jobs
An aesthetically pleasing dashboard is good, but the number one requirement for a tool to be successful is still how easy it is to use. Without great usability and UX, users won’t pick up your tool, even if it is the most brilliant in the world. Try to reduce the friction between the user and the interface and look for an intuitive angle.
Edward Tufte, the father of data visualization, gives a few tips on how to optimise visual representation of data:
- Graphical integrity: Make sure your data are trustworthy and proportionally represented within the right context.
- High data density: Shrink the graphical representation to its minimum shape, without losing information. A good way to do this is using Tufte’s sparklines. This is a very small line chart, typically drawn without axes, representing the general shape of the variation over time of a certain metric. It’s a graph at its simplest and most condensed way.
- Avoid ‘chartjunk’: Omit all graphical elements (shapes, colours, etc.) that could distract the users. Clarity is more important than attractive visuals.
- High data-ink ratio: If you were to print your data representation, the vast majority of the ink should be used for printing data and not for the visual elements surrounding the data. But Tufte also warns that you should try to maximise the data-ink ratio within reason. Again, clarity is the most important.
In the picture below you can see a comparison of how Google Analytics represents data with the way we show data in our dashboards.
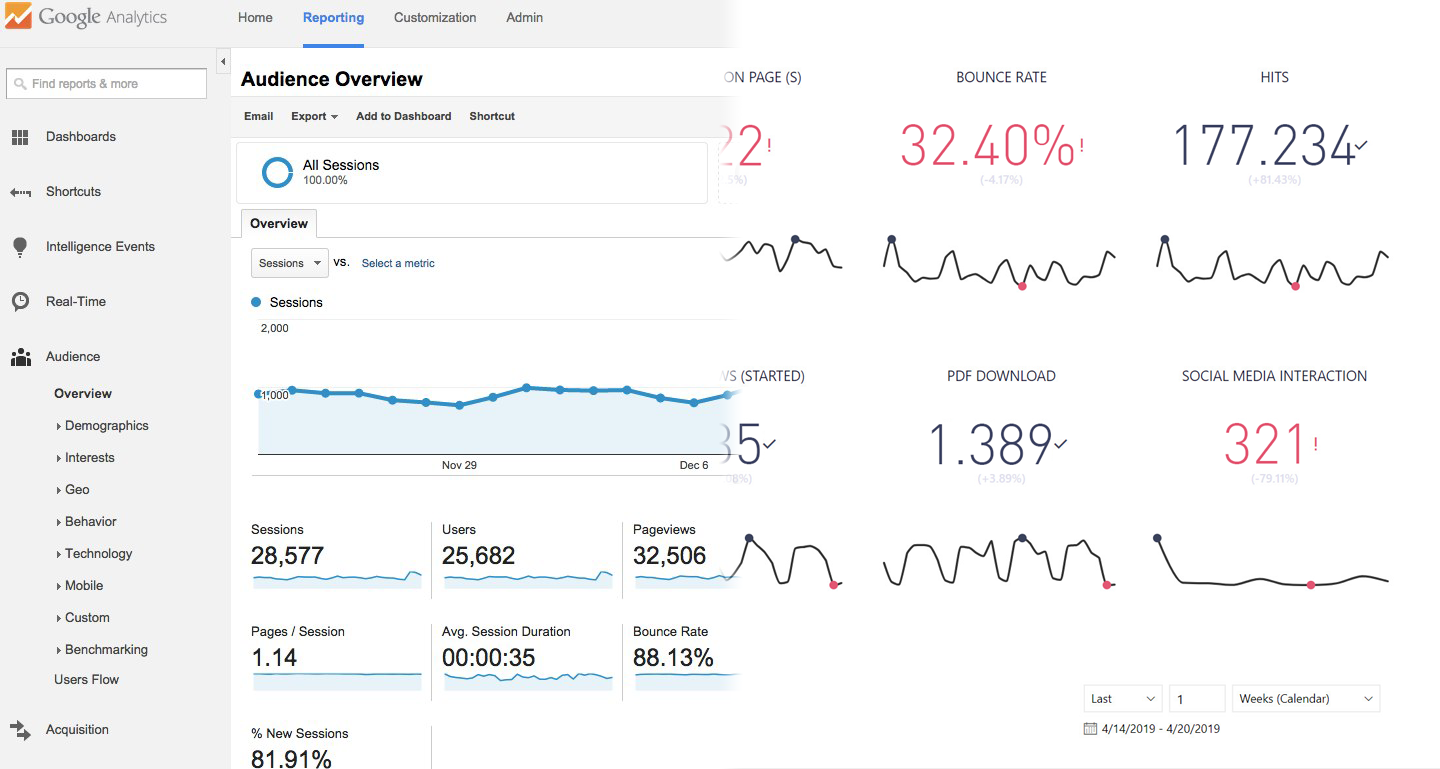 Google Analytics dashboard vs Making Waves dashboard
I think Tufte would be proud of our dashboard, right?
Our client’s dashboards
We combined our expertise about dashboard tools with the advice of Tufte and created personalised dashboards for our client’s employees. This way, the CEO can get high-level business insights, a marketeer can get a detailed overview of how many conversions a campaign is generating and a product owner will be able to keep close track of the number of page views of his portfolio.
We chose towork with Microsoft Power BI, for several reasons:
- It has a very efficient engine that can process large amounts of data and is generally a good fit for creating business intelligence analysis and reporting
- It offers the possibility to include other data sources from social media or other platforms
- It is a Microsoft tool, so it was not necessary to buy additional licenses
It allowed us to create a number of different dashboards, each showcasing different metrics and providing insights in the blink of an eye, bearing in mind Tufte’s principles of data visualisation for the graphical representation.
Please note that the pictures below contain fictional data:
- Traffic on different platforms
With Power BI you can create an overview of traffic from different channels and platforms into a single report. Gathering and comparing these numbers can give us an idea of the absolute and relative value of a certain platform.
 Track your traffic coming from different platforms.
- Conversion from online to offline
Another important metric is the number of conversions generated by different platforms. It gives insights about which platforms or pages generate both customer interest and actual inquiries of the services of our client.
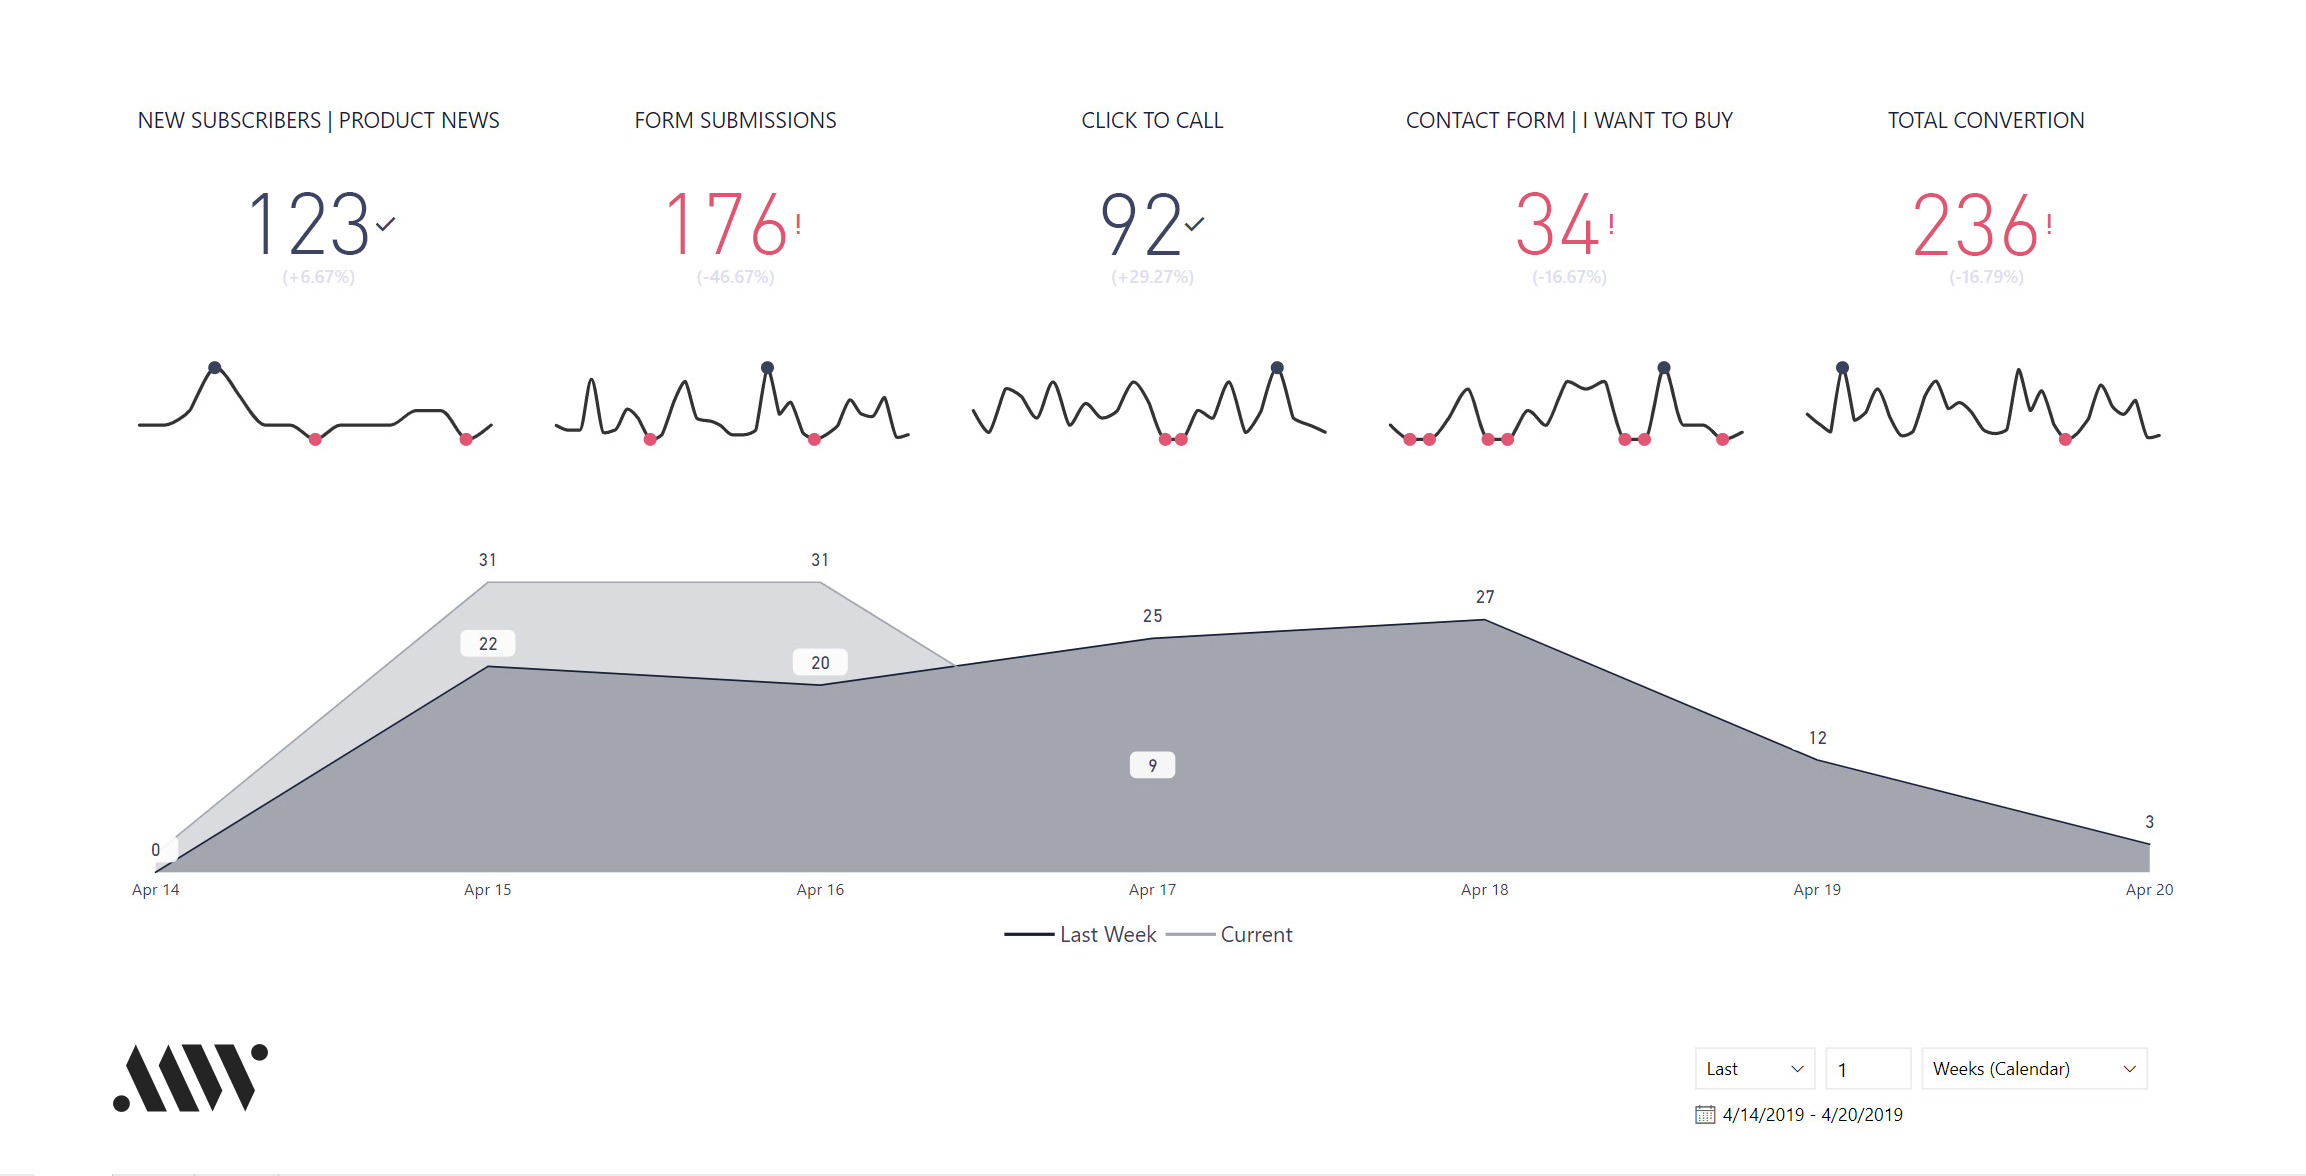 Track the evolution of your conversions.
- Interaction and engagement
Microsoft Power BI can also gather engagement data of different platforms to create a full overview of metrics as page views, bounce rate, unique visitors and many other. But it also allows to include company-specific KPIs in the dashboard. For our client, one of these KPIs is the number of downloads of PDF documents with equipment specifications. This is a good indication of genuine interest a company’s product portfolio.
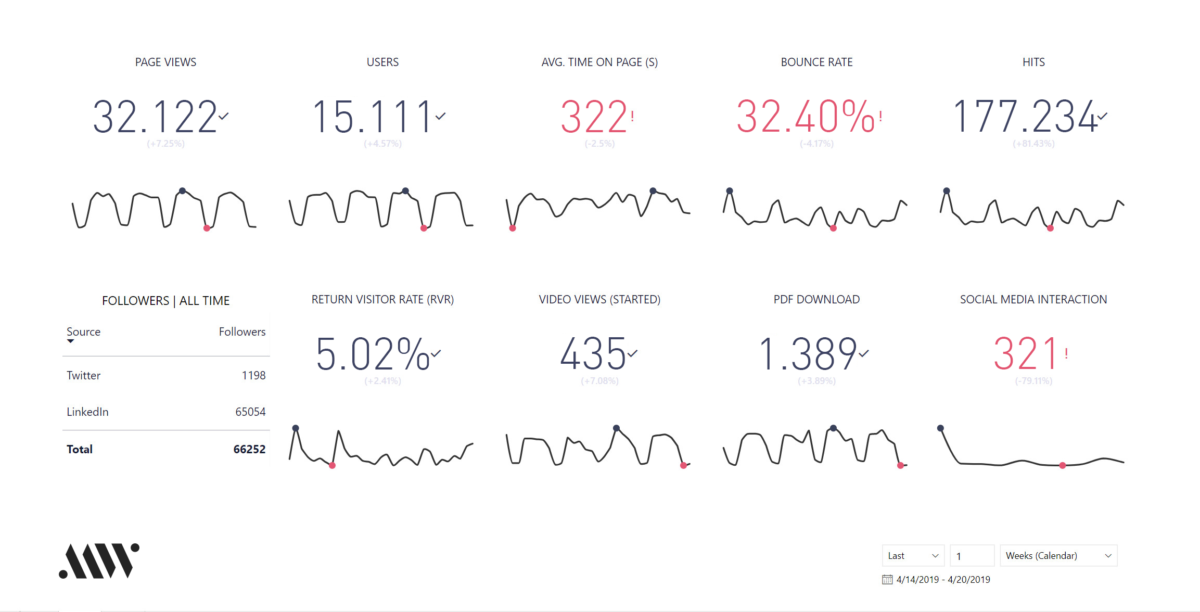 Keep track on how your users engage with your website.
If you would have any questions about leveraging your data in a dashboard, don’t hesitate to get in touch with us. We can look into creating a dashboard that fits your needs. Get in touch via post.uk@noaignite.com.
Co-author & editor: Pieterjan Benoit

Book expert consultation!
If you want to talk to our experts about this article or related question – just reach out!
Author

Paweł Strąg
Chief Technology Officer
The last 4 years of Pawel’s 18-year IT career has been spent exclusively on cloud platforms. He has a proven track record of delivering effective solutions for large enterprises and is currently involved in developing a highly-accurate cloud computing platform supporting wind energy calculations for wind turbines.
 LinkedIn
Related articles
![Two individuals are sitting on a sofa with a computer.]()
January 16, 2024 / 4 min read
Optimizely and Marketo integration: transforming B2B personalisation
In this article, we explain how we integrated Optimizely CMS and Marketo through a custom code layer to enable industry-specific personalization.
![Several women's clothes on a hanger.]()
November 15, 2023 / 5 min read
Are big brands starting to embrace second-hand sustainability?
In recent years, we have witnessed a surge in the popularity of second-hand fashion and consumer electronics. This trend extends beyond simply buying and selling pre-owned items; it's...

